Quick Starter Guide - Reports
From FPDS-NG
Contents
- 1 FPDS-NG ADHOC REPORTING TOOL
- 2 CREATING AN ADHOC QUERY
- 2.1 New and Find Button
- 2.2 To access the new report screen in Adhoc
- 2.3 To Create a New Report in Adhoc
- 2.4 To Select Attributes for a New Report
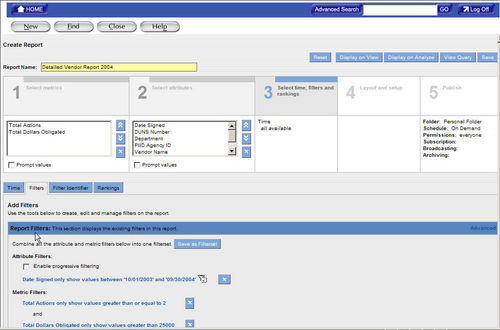
- 2.5 To Create Filters on a New Report
- 2.6 To Updating Filters on a new or existing report
- 2.7 To Save a Report
- 2.8 To Generate a Report
- 2.9 To Format the Report
- 3 DRIILING DOWN
- 4 HIGHLIGHTING METRIC VALUES
- 5 ADDING METRICS TO AN EXISTING ADHOC REPORT
FPDS-NG ADHOC REPORTING TOOL
Introduction
This section specifies instructions for creating reports based on your selected criteria. Agencies/Companies can create reports that answer their business questions and analyze processes. FPDS-NG uses the Informatica, Power Analyzer tool to create custom reports. Users have the option to save customized queries and reports in a personal folder specific to their User ID.
Adhoc Reporting Features
Selecting Ad Hoc will display the query panel and standard tool bar. The Ad Hoc Reporting Screen contains a personal folder where saved queries are stored specific to the user’s ID. The following screen will display when the user opens Adhoc for the first time using the Informatica tool.
CREATING AN ADHOC QUERY
Adhoc reporting is a user friendly feature designed for all levels of users. Custom reports are created using queries. A query is one or more statements that request data from a database. If the data is available, then the requested data returns in the form of a table which contains rows and columns that create a report. Queries are sent to the databases in a language called SQL. However, when using the Report Panel, SQL knowledge is not required.
New and Find Button
The New button displays a new screen that allows you to create analytic reports from the FPDS-NG data by using a query. A report consists of a set of related metrics and attributes. The queries are based on metrics, attributes filters specified by the user in the report. When a new report is generated, Ad Hoc displays the queries from the database. You can modify the data and the format of a report. The Find button allows you to access your personal folder from other screens in Adhoc. Any saved queries you have will be stored in your personal folder.
To access the new report screen in Adhoc
- Access the Adhoc reporting tool from the main navigation screen.
- Select the New Button
 located at the top left side of the reporting screen. The Create Report Screen will display as shown below.
The Create Report screen is used to select and enter analytical information for a report. This screen is divided in to four sections designed to create a query for a report.
To Create a New Report in Adhoc
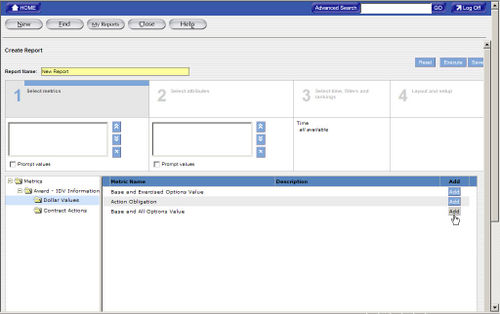
The first step in creating a report is specifying the data for the report. Section 1 Selecting Metrics adds the measures to evaluate a business process. Metrics are always numeric values. For example, Dollars Obligated, Actions Count, and Base and All Options Value are metrics that provide measurable information used to determine trends in federal spending.
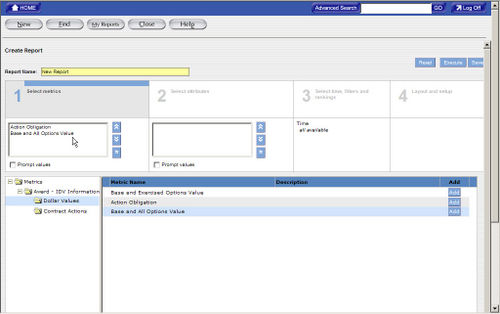
- Select the add button
 next to the desired metric(s). The chosen metric(s) is added to the metric box in section 1.
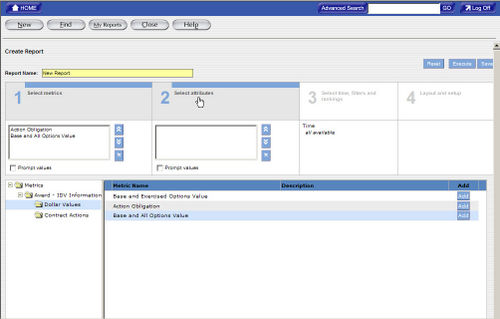
 - After selecting metrics click, Section 2 Selecting Attributes to add an attribute to the report.
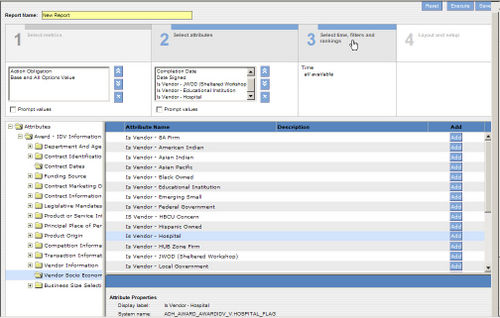
To Select Attributes for a New Report
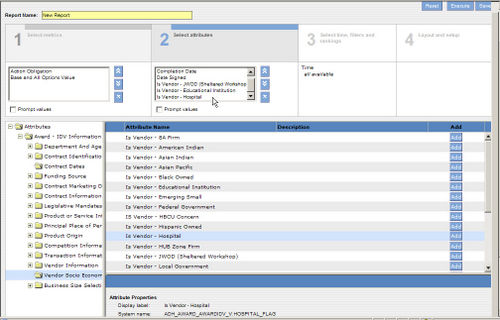
Attributes are the factors that determine the value of a metric. For example, Date Signed, Product Services Codes, and Contracting Office Names are attributes. If you want to create a report that tracks Dollars Deobligated and Total Actions for a specific agency, you need to identify attributes that determine the values of these metrics.
- Select the add button
 next to the desired Attribute(s). The chosen attributes are added to the attribute box in section 2.
 - After selecting attributes click, Section 3 Selecting Filters to add a range to the report.
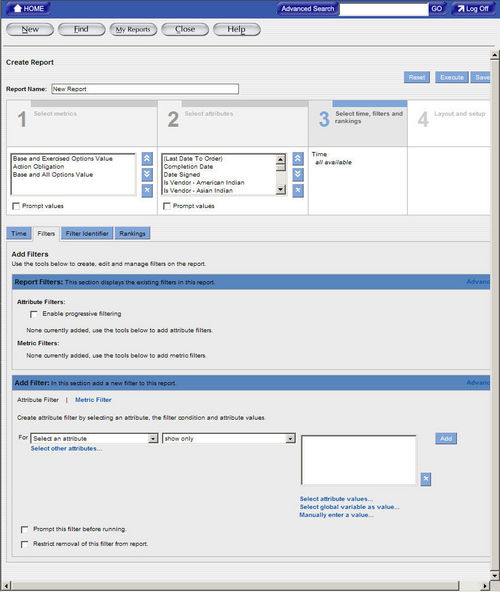
To Create Filters on a New Report
You can use a filter in your report to set a range for the report data. When creating a report, a range is used to limit the search of the query to your specifications. This range depends on the business question that you want answered.
- The Attribute Filter link will display highlighted in black shown in the following example. This link is used to access filters for each Attribute.
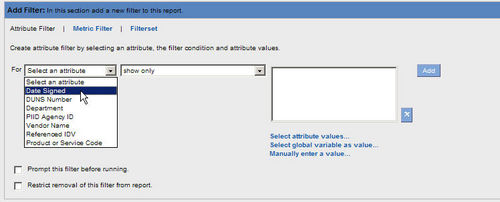
- Use the drop down menu to highlight and select the Attribute Filter.
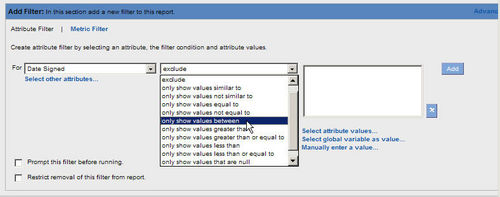
- After selecting the Attribute Filter, use the drop down menu to highlight and select the operator that provides the range for the Attribute values.
- Provide a range for the filter by entering information in the Attribute Value box.
- Select
 to save the filter values in the Report Filters section of the screen.
 - The Metric Filter link will display in the Add Filter section. When the Metric Filter link is selected it displays highlighted in black shown in the following example. This link is used to access filters for each Metric.
- Use the drop down menu to highlight and select the Metric Filter.
- After selecting the Metric Filter, use the drop down menu to highlight and select the operator that provides the range for the Metric values.
- Provide a range for the filter by entering information in the Metric Value box.
- Select
 to save the filter values in the Report Filters section of the screen.
To Updating Filters on a new or existing report
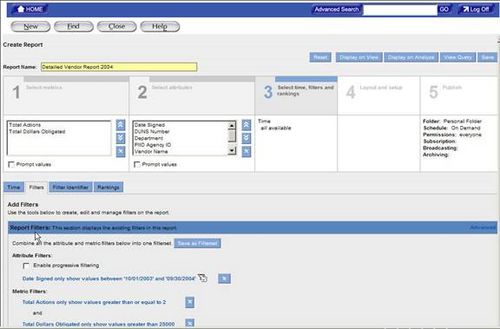
Filters are stored under the Report Filter Section in section 3 Select Time, Filters, and rankings. Use the following steps to update Attribute and Metric Filters.
- To make changes to an existing filter Click the blue link of the filter. For example select .
- The selected filter link is highlighted in green and displays the information in the Edit Filter section.
- Make the changes to the filter by selecting information from the drop down menus or entering new information in the Values field(s).
- When the changes are completed select to store the changes in the Report Filters Section.
To Save a Report
When a query is created the information can be saved and used again when needed. You can save the query after adding filter information. Use the following steps to save report queries.
- Enter a name in the report name field shown in the following example.
- Select to store the query in your personal folder.
To Generate a Report
After adding the report filters and ranges the report can be generated. To keep changes made to the query select save or generate the report and save the query from the displayed report screen.
- To generate a report select . The report will display as similar to the following example.
To Format the Report
The final step in creating reports is selecting the formatting for the report. Section 4 Layout and Setup is used to customize the visual display of your report. Calculations can be added for metric filters in the report. You can also modify the date formats, display, and fonts in the report. Use the following steps to format a report.
- To add a sections to a report select the Table Layout Tab.
- To create the report with sections, drag an attribute to the Section Attribute area. The selected attribute displays in the Section Attribute area. You can also drag attributes from the Section Attribute area to the Row Attribute or Column Attribute areas.
Creating sections in a report will display the report divided by the attribute you have chosen. For example, choosing the funding agency ID will display the report information in sections for each ID.
- To add a calculation to the report select the Calculating Tab. The following screen will display.
- Select the drop down menus next to Show seen in the following example.
- Select the type of calculation desired for a metric filter.
- Select the drop down menu to select the metric for the previously chosen calculation.
- To display the subtotals for a specific column click the check box and select the drop down menu for Show Subtotals. Click the attribute that will display the subtotals.
- Select to place the calculations in the Summary section.
- To change the formatting for the report, select the Formatting Tab. The following screen will display.
You select formats for metrics and attributes on the Formatting tab. These formats determine how the metrics and attributes display in the report table.
- The keep the changes made to the report formatting select or .
The save as function will allow you to make changes to the query and save the changes without overwriting the original query.
DRIILING DOWN
Drill Down Feature
The drill feature provides other attributes or metrics at a lower level related to the current report that is displayed. The following section Drilling into a Report explains how to shift from a general view of the report data to a more detailed view using the drill down feature. Drilling into a Report When drilling into a report, attribute or metric values are selected for the drill. The reporting tool uses these values as a drill filter. The drill filter determines the data seen in the drill results. More than one attribute or metric value for the drill can be selected. Contents
To Drill into a Report
To drill into a report:
- Open the report you want to drill into. The report displays on the Analyze tab.
- To select the attribute value for the drill click on the department name that will be used to filter the report information.
-Or-
- To select all of the attribute values for an attribute click on the attribute header.
Note: To select more than one attribute column hold down the Ctrl key while clicking on the title of each attribute column desired. To select a contiguous range of values use the shift key while clicking the attributes. To select a non-continuous range of values use the Ctrl key while clicking the attributes desired.
- Click Drill. The reporting tool displays the available drill paths on the Drill tab.
-Or- In the report table, right-click the selected values, and then click Drill to view available drill paths. You can select those attributes from the available drill paths that are not already part of the report. Each attribute can have one primary drill path and multiple secondary drill paths. The primary drill path allows you to follow a standard path of inquiry for the attribute.
- From the available drill paths, select the attribute to display in the report.
For example, if the report currently displays the report government wide select the department attribute for “Homeland Security”, and then select the contracting Agency attribute to display the agencies (i.e. Coast Guard, Transportation Security Administration) for the selected department (Homeland Security). The report drill filter will show all agencies associated with “Homeland Security” for the reporting period.
- To go back to the original report, click the Original Table link in your current drill path header.
Tip: To view a description of the drill filters and the appendix of the report select the (i) icon. The appendix will display with the report filter information.
Drilling into a Report with a Primary and Secondary Drill Path After the drill filter is created, additional attributes can be selected for the report. Drilling into a report allows you to filter attribute values and see additional attributes in reports. Additional attributes are selected from a predefined drill path. The predefined drill path lists the attributes that are available for selection to display in the report. The primary drill path allows you to follow a standard path of inquiry for the attribute. All other related drill paths appear in the report as secondary drill paths. The reporting tool displays both primary and secondary drill paths for all Metrics in a report.
To Use Primary and Secondary Drill paths
1) To drill using primary and secondary drill paths select an attribute value on the report. Right click on value and select drill. 2) To use a secondary drill path to filter further in to the report data right click on the Department “Homeland Security” and select drill. Select Vendor from the available drill path. Step 2 will select all Vendors associated with the Department of Homeland Security. This will display all Vendors for all Agencies as well. 3) To sort the Vendor results and look for Vendors with multiple entries use the sort button. When sorting by Vendor the report will allow you to find a vendor used more than once by an agency more efficiently. Drilling Using Two Primary Drill Paths Another drill feature available in the standard reports allows you to select from two primary drill paths. When a metric is used to filter the report two drill paths are available for selection. The first drill path filters by Contracting Agency level. The Contacting Agency drill path lists the selected drill filter by each agency. The second drill path filters by Department level. The Department drill path filters by grouping the selected drill filter for agencies. The following steps are provided to show how this concept works. Contents
To Use Two Primary Drill Paths
- Select a Department (Homeland Security will be used in this example) and drill down to the Contracting Agency level.
- Select a metric, such as Total Dollars Obligated. Right click on the metric and select drill.
- Select Vendor from the first available drill path shown in the following figure.
The report displays all vendor information for each agency shown in the following figure.
To Select the Second Primary Drill Path
- Select a Department (Homeland Security will be used in this example) and drill down to the Contracting Agency level.
- Select a metric, such as Total Dollars Obligated. Right click on the metric and select drill.
- Select Vendor from the second available drill path.
The report groups all vendor information and filters by the department level for each agency.
HIGHLIGHTING METRIC VALUES
You can use colors, patterns, or symbols to highlight metric values in a report table. You can highlight metric values in a report that are above, below, or within a range. Highlighting allows you to draw attention to critical data in a report or pinpoint problem areas. If you highlight metric values in a report, the highlighting also appears in all bar charts you create for that report. In the charts the reporting tool displays highlighting as colored dots. Colored dots are a type of highlighting format. Creating a Highlighting Rule Contents
Specifying Ranges
When you create a highlighting rule, you specify three ranges (low, medium, and high) for the values that you want the reporting tool to highlight. You must enter numeric values that correspond to the values in the report table. These ranges must be in the ascending order. Contents
Highlighting Rule
To create a public highlighting rule, you must have write permission on the report. To create a personal highlighting rule, you must have read permission on the report. Contents
To Create a Highlighting Rule
- Open the report where you want to create a highlighting rule. The report displays on the Analyze tab.
- Click the metric name for which you want to create the highlighting rule. The reporting tool selects the column for the metric.
- Click Highlighting. Or, Right-click the metric name on the shortcut menu, click Create Highlight. The reporting tool displays the Highlighting tab.
- Enter the following information:
Property Required/optional Description Name the highlighting rule field This field is required This field is used to name the highlighting rule. After the highlighting rule is named, and then saved, it is stored on the Analyze section where it can be edited or deleted. Specify numeric values for each field These fields are required The fields available specify numeric values for ranges for the metric or calculation.
The ranges must be in ascending order.Then highlight function is optional Select colors for each range of values. The system defaults with red for low numeric values, yellow for medium numeric values, and green for high numeric values. Specify formatting for highlighting This function is optional Select the type of formatting you want to use for highlighting the range of numeric values. The system defaults with a background color for each numeric value. - Click OK. The highlighting rule appears in the Highlighting task area on the Analyze tab. The highlighting is displayed in the report table.
Modifying a Highlighting Rule
You can modify the name, value ranges, colors, format, state, and user access of a highlighting rule. To modify a public highlighting rule, you must have write permission on the report. To modify a personal highlighting rule, you must have read permission on the report.
To modify a highlighting rule:
- Open the report where you want to modify a highlighting rule. The report displays on the Analyze tab.
- To change the state of a highlighting rule, right-click the highlighting rule name. A shortcut menu appears.
- On the shortcut menu, click Inactivate to inactivate an active highlighting rule. Or,Click Activate to activate an inactive highlighting rule.
- To modify any aspect of the highlighting rule, in the Highlighting task area, click the highlighting rule name. The reporting tool displays the Highlighting tab.
- On the Highlighting tab, make the necessary changes. Click OK.
Deleting Highlighting Rules
When you delete a highlighting rule, the reporting tool deletes the highlighting from the report table and the highlighting rule name from the Highlighting task area. To delete a public highlighting rule, you must have write permission on the report. To delete a personal highlighting rule, you must have read permission on the report. Contents
To Delete a Highlighting Rule
To delete a highlighting rule:
- Open the report where you want to delete a highlighting rule. The report displays on the Analyze tab.
- Right-click the highlighting rule name, on the shortcut menu, click Delete. Or,In the Highlighting task area, click the highlighting rule name. The reporting tool displays the Highlighting tab.
- Click Delete. The reporting tool deletes the highlighting from the report table and the highlighting rule name from the Highlighting task area.
ADDING METRICS TO AN EXISTING ADHOC REPORT
To Add Metrics to a Report
To add a metric to an existing report:
- Select the Folder where the report is located.
- Click the name of the report to highlight the link for the report.
- Click Edit, and then select Metrics. A list of available metric folders displays in the Metric Folders task area and in the Results task area. When selecting a metric name in the Results task area additional information is displayed about the metric in the Details task area. In the Details task area, the Usage Description field provides a detailed description of the metric, if available. The Description field displays a brief description of the metric, if available.
- Click the metric folder from where you want to add metrics. Or, Create a query to display the metrics being added to the report. To use a previously saved query, click Saved Queries, and then click a query. A list of metrics displays in the Results task area.
- Click the metric that will be added to the report.
- Click Add for the metric. Multiple metrics can be added to the report. The selected metrics appear in the box under Select Metrics.
- To remove a metric from a report, select the metric that will be deleted from the report, and then click the Remove button.
- To change the order of a metric in the report, click the metric, and then click the Move Up or Move Down buttons. The order of metrics in the report determines the order in which the metrics display in the report table on the Analyze tab.
- To create a prompt for metrics, select Prompt Values. When displaying this report the reporting tool prompts the user to select the metrics they want to display in the report.
- To save the report, click Save.
To Add an Attribute to an Existing Report
To add an Attribute to a report: Use the steps listed below to add an attribute to a report use:
- Select the Folder where the report is located.
- Click the name of the report to highlight the link for the report.
- Click Edit, and then select the Attributes window. A list of available attribute folders displays in the Attribute Folders task area. The Attributes display in the Results task area. When selecting an attribute name in the Results task area additional information is displayed about the attribute in the Details task area. In the Details task area, the Usage Description field provides a detailed description of the attribute, if available. The Description field displays a brief description of the attribute.
To remove an attribute from a report, select the attribute you want to remove, and then click the Remove button.
- To change the order of an attribute in the report, click the attribute, and then click the Move Up or Move Down buttons.
The order of attributes in the report determines the order in which the attributes display in the report table on the Analyze tab.
- To create a prompt for attributes, select Prompt Values.
When you display this report, the reporting tool prompts you to select the attributes you want to display in the report.
- To save the report, click Save.
Attribute Filter
You can use global variables in attribute filters. A global variable holds any attribute value that you might want to use in a report filter. It allows you to have a different value for an attribute filter each time you run a report without changing the filter. Contents
To Create an Attribute Filter
To create an attribute filter:
- Click Create Report, Select Time, Filters, and Rankings Filters. The Filters tab displays.
- In the Attribute Filter Selection task area, click Select an Attribute to select an attribute for the filter.
The attribute list displays the attributes in the current report.
- From the operator list, select an operator for the filter. If you create a prompt for the attribute filter, you do not need to enter attribute values for the filter. You can skip the following step. If you select attribute values, when you display the report, the reporting tool populates the prompt with those values.
- Select values for the filter by choosing one of the following options:
- To select values for the filter from the list of available values, click Select Attribute Values.
- The Choose Attribute Values window appears with the first 100 values.
- To search for an attribute value, enter the attribute value in the text box, and then click Search.
Or
To use a global variable as a value, click Select Global Variable as Value.
-Or-
To manually enter an attribute value, click Manually Enter a Value. Enter an attribute value for the filter, and then click OK. Or Enter a value or values in the text box. Depending on the operator you selected the text box might display for the attribute values.
- To create a prompt for the attribute filter, select Prompt this Filter Before Running, and then enter the text for the prompt.
When the report displays you are prompted select the attribute values you want to display in the report. The text for the prompt appears in italic to the left of the attribute values.
- To display attribute values in a progressive manner, in the Attribute Filter Selection task area, select Enable Progressive Filtering.
Select this option if there are multiple prompts in the report and you want to display attribute values for a subsequent prompt based on the values selected in the previous prompt.
- To restrict users from removing a filter from the report, select Restrict Removal of this Filter from Report. The filters do not display in the Filters task area on the Analyze tab.
- To add another attribute filter to the report, repeat steps 3 to 7. After you add a filter to the report the reporting tool displays another set of filter options in the Attribute Filter Selection task area. The filters are applied to the report in the order in which they appear in the Attribute Filter Selection task area.
By default the attribute displays filters in basic mode. Note: If the SQL query for the filter contains a single quote (‘) within a string, you must change this single quote to a two single quotes.
- To remove an attribute filter, click the Remove button for the filter.
- To save the report, click Save.


